
In recent years, tracking the 80th and 90th percentiles of scoring categories has become commonplace in NFBC circles, and rightfully so. It’s an effective way to both set benchmarks for drafts and track a team’s performance during the season. This offseason, I wanted to dig a bit deeper into that concept.
To coincide with some NFBC Champions League prep, I looked at the average percentiles for each scoring category (plus at-bats and innings pitched) for Top 25 teams in the Main Event, Online Championships, and Draft Champions over each of the past three seasons. I then took this a step further and split up the Top 10 teams and teams 11-25 for each contest. The goal here was to first see how teams are most consistently getting into the Top 25, and then look at how those firmly in the hunt for an overall title consistently separate themselves from the pack.
None of this analysis is meant to say hitting any of these average percentiles for any of these contests is the only way to make it near the top of the overall standings. Teams come in all shapes, sizes, and styles, and best managers adapt to their team’s strengths and flaws accordingly. My personal goal for the Champions League is to try my best to reach the Top 25 in each contest entry. This practice helped me get a quick look at what’s collectively been the most successful routes to the top in recent years.
Let’s start by taking a look at the Main Event over each of the past three years and 2021-2023 combined.
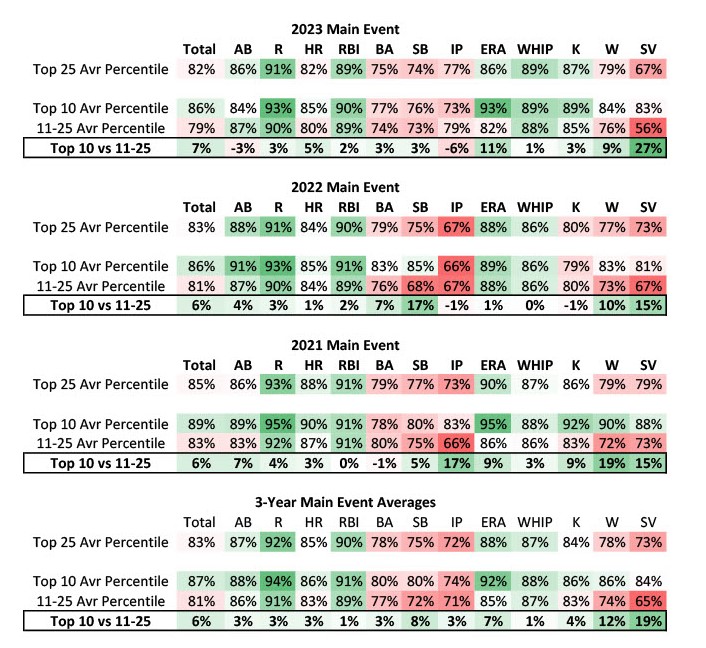
The most popular foundation for Top 25 Main Event teams is to hammer R, RBI, ERA, and WHIP. If you’re hitting or coming close to the 90th percentile in all four of those categories, you’re probably doing pretty well.
For the hitting categories, there are no real huge surprises to me here. If you’re short in R or RBI, it’s going to be damn hard to crack the Top 25. There are no noticeable offensive advantages Top 10 teams consistently possess. Stolen bases were a huge differentiator for Top 10 teams in 2022, but that vanished with the 2023 rule changes. With a juiced offensive environment last season and weekly hitter streaming becoming more popular each year, using at-bats as a way to edge into the Top 10 has dwindled. The at-bat edge for Top 10 teams has declined each of the past three seasons to the point where top 10 teams in 2023 had less at-bats on average than teams 11-25.
This is already common knowledge, but the Main Event is all about pitching. Knowing how near-impossible it is to bank on ERA or WHIP gains from the Main Event FAAB pool, managers should see those 3-year Top 25 average percentiles for ERA and WHIP (88% and 87%, respectively) and, if they weren’t already, prepare to leave their drafts with as many high-quality starting pitchers as possible.
Year after year, finishing near the top of the Main Event boils down to how many wins and saves you have. Unlike stolen bases, MLB isn’t changing its rules to help beef those numbers up, so it’s left to fantasy managers to figure out how to best position themselves to make those gains. The consistently seismic gap between Top 10 teams and those 11-25 underscores the value of any edge to be found.
A side note about saves. The huge year-to-year edge for Top 10 teams here is not just from drafting and FAABing the right closers, but simply by virtue of them not punting the category. Consider how the Top 25 Main Event finishers faired in saves in 2023:
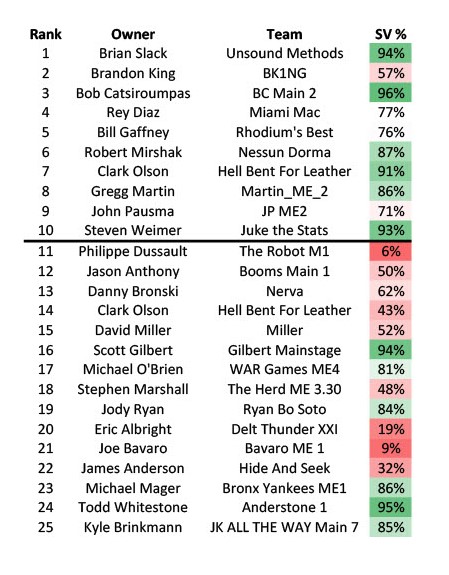
Three teams ranked 11-25 straight-up punted the category (less than 20%), likely fairly early on in the season, and five others failed to reach the 60th percentile. To me, this highlights that punting saves can be an effective strategy to move up the overall standings, but in most cases can only get you so far.
Here are the same tables for the 2021-2023 Online Championships:
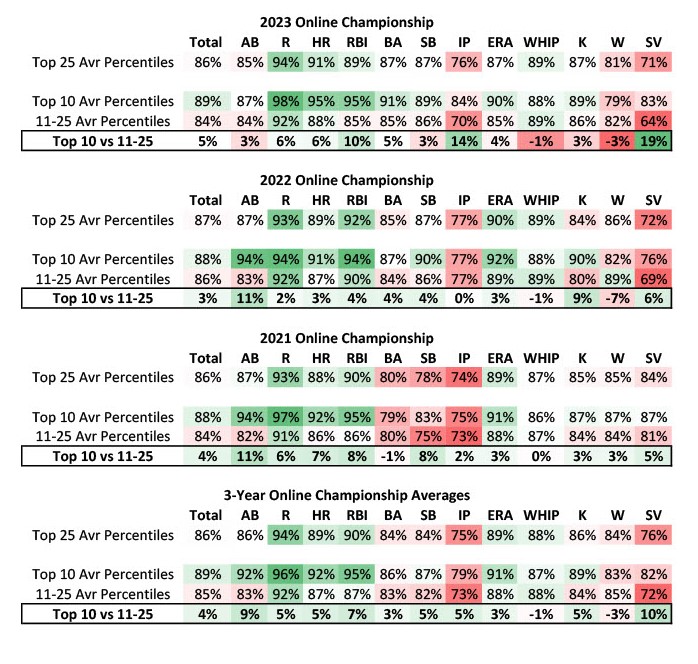
Unlike the Main Event, offensive rules the OC. That most Top 25 teams are near the 90th percentile in homers and RBI and the 95th percentile in runs is staggering. When you consider that these categories are also among the biggest differentiators for Top 10 teams, it really drives home to me how important it is to land as many 100-100 or 90-90 hitters as possible. In the OC, I may be even more inclined now to bump up players on MLB’s best offenses to open myself up to the most potential 100+ run and RBI seasons. These percentiles are massive offensive benchmarks to strive for.
Unlike the Main Event, there is a decent gap in at-bats here for Top 10 teams versus 11-25 finishers, however, it did shrink from 11% in both 2021 and 2022 to just 3% in 2023. Also unlike the Main Event, you’re not streaming nearly as much when the player pool is only 360 compared to 450. For me, this again shows the importance of having everyday studs at every spot on an OC roster.
For OC pitching, nothing jumped off the page. Much like the Main Event, your best shot at the Top 25 is a strong foundation in ERA and WHIP that approaches the 90th percentile, wins and Ks above the 80th percentile, with saves often being the wildcard. Seeing that, similar to saves in the 2023 Main Event, there was again a mammoth difference in the 2023 OC save percentiles between Top 10 teams and teams 11-25 shows what a difference maker saves were last season.
Here are the same tables for the 2021-2023 Draft Champions:
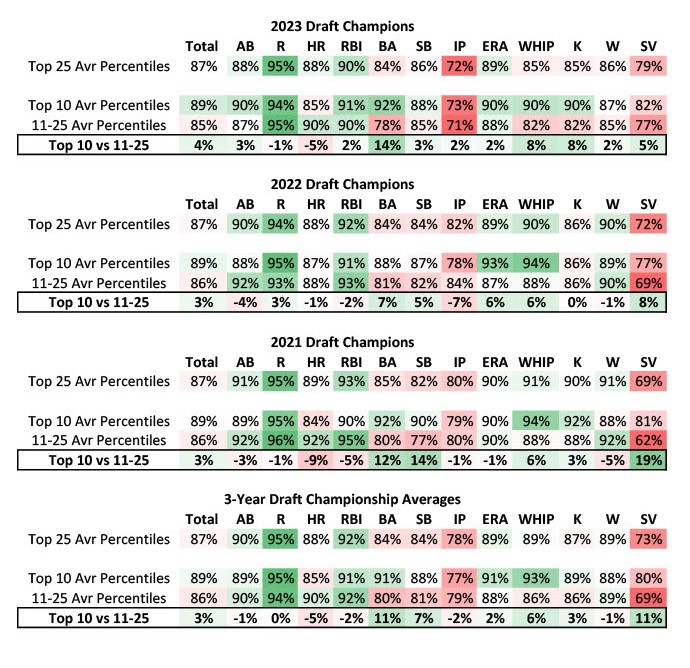
Not to sound like a broken record, but, again, these are monster offensive percentiles to reach. One surprise for me here was that Top 10 DC teams have, on average, a huge edge in batting average but less homers than teams 11-25. That trend is present in each of the past three seasons. I’m not smart enough to know why this might be more true in the DC than the OC or Main Event, but it’s a solid trend. Avoiding batting average sinks may be important here. This also had me thinking about what spots on a DC roster that are typically filled by low-average sluggers might be better filled by good batting average plays. My first thought was catcher, and to perhaps fade the Cal Raleighs of the world for Gabriel Moreno-types.
For Top 25 DC teams, ERA, WHIP, strikeouts, and wins, are slightly more bunched together near the 90th percentile than in Main Event or OC. WHIP also stands out as being a more consistent differentiator for Top 10 DC teams than those in the other contests. Both these points underscore the importance of drafting extremely deep starting rotations you feel safe with. Not being able to drop an Alek Manoah for 27 weeks is no fun, and you’re not coming close to the 90th percentile in wins or strikeouts if you’re forced into several weeks of three or more relief pitchers when your starters get hurt.
To wrap all this up, I don’t think any of these percentiles should be taken as draft day benchmarks to shoot for, especially in FAAB leagues like the Main Event and OC. FAAB moves and in-season management are huge factors in how managers are reaching these goals. Hopefully, this brings some light into what’s worked for successful managers in these contests in recent years and helps give us some ideas about how we all want to try and earn a seat at the Champions League table.
