
There’s just under eight weeks left in the baseball season. This is the stretch where championships are won and owners grinding in the middle of the pack make their push into cash spots. One practice I like to incorporate this time of year is really diving into what’s realistic for my team to accomplish by estimating what I’ll need in different categories to gain the points in the standings.
Where you can and can’t gain points and how many points you can lose in each category is sometimes obvious. A quick glimpse at the standings and writing down your potential +/- in each category is a good start. I like to dig in a bit more to confirm what I eyes tell me, check my expectations back into reality, and give me some concrete goals to build my roster around.
The charts in this post show the current 10th-90th percentiles in the NFBC Main Event for each of the 10 scoring categories, the weekly average for each category, and what an owner needs to average per week rest of season to hit a given percentile level. While based on the Main Event’s overall standings, these can be used to estimate individual league point totals and goals as well. I’ll explain how later.
This can be a surprising and sobering exercise. Before deciding to punt saves, go all in steals, or thinking you can cut you ERA from 4.00 to 3.50 in eight weeks, it’s a good practice to consider what that will realistically take.
This is also a time-consuming practice. You probably won’t be able to do this for each category on every team. I like to dive into this when I’m involved in a tight race at the top or looking to make a big decision on a shift in roster approach – “Can I afford to run six SPs and three RPs out without losing too many points in Ks? If I add another SB threat, what will that do to my HR and RBI total?”
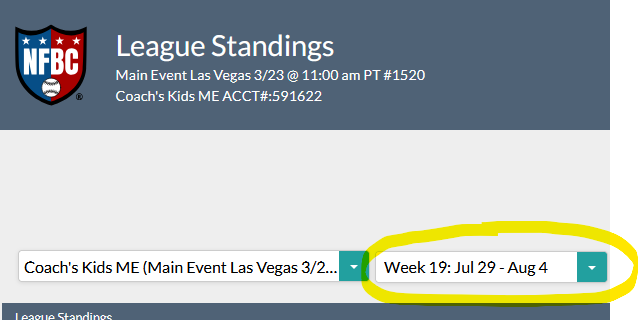
For an example, I’ll take stolen bases from my Main Event CLQ, a category owners commonly try to punt or go ham on as the season winds down. All stat totals for these charts were pulled from the end of Week 19 (Aug. 4). If you’re looking at this midweek and want an accurate comparison of your stats with these charts, you can rollback to the end of Week 19 standings on the drop-down highlighted below.
Here are the the standings for stolen bases in this league as of the end of this past Sunday’s games.
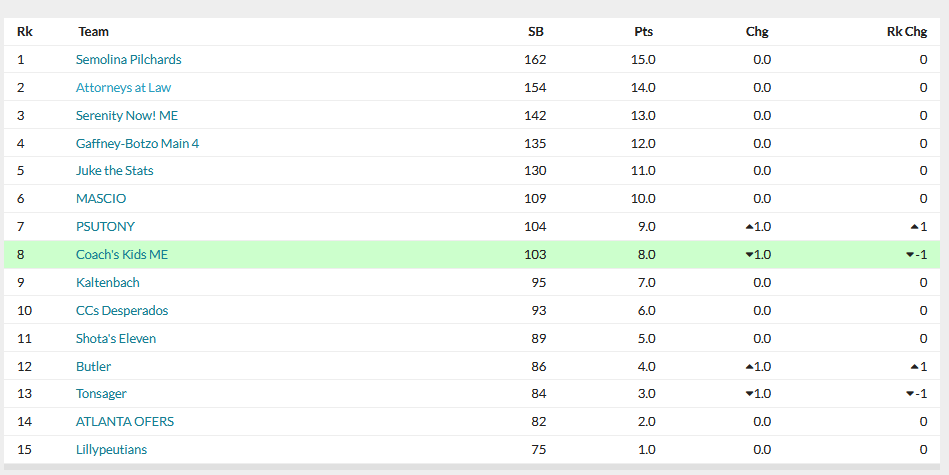
Common sense says I can gain two points in steals and have no shot at reaching the guys at 130 and 135. Let’s check the rest-of-season estimates.
Stolen Bases
| % | YTD | For 90th | For 80th | For 70th | For 60th | For 50th | For 40th | For 30th | For 20th | For 10th |
| 90th | 139 (7.3) | 7.3 | 5.5 | 3.8 | 2.7 | 1.8 | 0.7 | 0.0 | 0.0 | 0.0 |
| 80th | 129 (6.8) | 8.6 | 6.8 | 5.0 | 3.9 | 3.1 | 2.0 | 1.1 | 0.2 | 0.0 |
| 70th | 119 (6.3) | 9.8 | 8.0 | 6.3 | 5.2 | 4.3 | 3.2 | 2.4 | 1.5 | 0.0 |
| 60th | 113 (5.9) | 10.6 | 8.8 | 7.0 | 5.9 | 5.1 | 4.0 | 3.1 | 2.2 | 0.8 |
| 50th | 108 (5.7) | 11.2 | 9.4 | 7.6 | 6.6 | 5.7 | 4.6 | 3.7 | 2.8 | 1.4 |
| 40th | 102 (5.4) | 11.9 | 10.2 | 8.4 | 7.3 | 6.4 | 5.4 | 4.5 | 3.6 | 2.2 |
| 30th | 97 (5.1) | 12.6 | 10.8 | 9.0 | 7.9 | 7.1 | 6.0 | 5.1 | 4.2 | 2.8 |
| 20th | 92 (4.8) | 13.2 | 11.4 | 9.6 | 8.6 | 7.7 | 6.6 | 5.7 | 4.8 | 3.4 |
| 10th | 84 (4.4) | 14.2 | 12.4 | 10.6 | 9.6 | 8.7 | 7.6 | 6.7 | 5.8 | 4.4 |
Here is how to read this. The column on the far left is the given percentile. The column second from the left is the year-to-date total for the given percentile (weekly average in parenthesis). Each of the following columns is what I would need to average per week the rest of year in stolen bases to reach a certain percentile at season’s end.
For my team, I have 103 SB, so I can approximate the current 40th percentile (102 SB). The team I think I can realistically reach currently has 109 SB, or closest to the 50th percentile. Per the chart, to go from the 40th to the 50th percentile would 6.4 steals per week. Seems very realistic. I’ll probably target 7 per week to be safe.
To reach the owner currently at 130 SB (80th percentile), I’d need to average 10.2 steals per week for two months. Not realistic.
From here, I’d look at what my roster is projected to do and see if the 14 batters I plan on using most can get 7 steals per week. The BAT has them for a combined 52 steals, or 6.5 per week for the next eight weeks. Pretty solid. I may need to make sure I don’t fall too far off pace, but also don’t have a desperate need.
This type of analysis comes with a mountain of caveats. What if one of the guys ahead of me I’m targeting has better SB threats? What if one of the owners in the 130-135 SB range punts steals the rest of the way? What if I just added a major speed threat to my team? Are the projections wrong? There are tons of hypotheticals. If you’re going for an overall or a spot at the CLQ final table, you’re also going to handle your approach differently.
Looking at this chart at least gives me some basic information: 1) My team as constructed looks like it could gain a few points in SB; 2) It’s probably not a good use of my remaining FAAB to target a big SB boost, since my roster has some speed and I’d probably have to average around 10 steals every week (and insane number) just to gain an extra point or two more than I’m projected for.
I hope this all makes sense and you find this helpful and applicable to any category you’re going after or tough roster decision. I’ve listed all the charts below along with some notes. For quick reference and an easier-to-read format, this Google Sheet also has all the charts as well: RoS Category Targets (Week 20).
Note that while this is at least fairly applicable to most 15-team leagues with NFBC-type rosters, 12-teamers would require a different set of comparison charts.
Runs
| % | YTD | For 90th | For 80th | For 70th | For 60th | For 50th | For 40th | For 30th | For 20th | For 10th |
| 90th | 743 (39) | 39 | 36 | 34 | 31 | 29 | 27 | 25 | 22 | 18 |
| 80th | 725 (38) | 41 | 38 | 36 | 34 | 32 | 29 | 27 | 24 | 20 |
| 70th | 712 (37) | 43 | 40 | 37 | 35 | 33 | 31 | 29 | 26 | 22 |
| 60th | 699 (37) | 45 | 41 | 39 | 37 | 35 | 33 | 30 | 27 | 23 |
| 50th | 688 (36) | 46 | 43 | 40 | 38 | 36 | 34 | 32 | 29 | 25 |
| 40th | 667 (36) | 47 | 44 | 42 | 40 | 38 | 36 | 33 | 30 | 26 |
| 30th | 663 (35) | 49 | 46 | 44 | 41 | 39 | 37 | 35 | 32 | 28 |
| 20th | 664 (34) | 51 | 48 | 46 | 43 | 41 | 39 | 37 | 34 | 30 |
| 10th | 623 (33) | 54 | 51 | 49 | 46 | 44 | 42 | 40 | 37 | 33 |
HR
| % | YTD | For 90th | For 80th | For 70th | For 60th | For 50th | For 40th | For 30th | For 20th | For 10th |
| 90th | 213 (11) | 11 | 9 | 8 | 7 | 6 | 5 | 4 | 3 | 1 |
| 80th | 203 (11) | 12 | 11 | 9 | 8 | 7 | 6 | 5 | 4 | 3 |
| 70th | 196 (10) | 13 | 12 | 10 | 9 | 8 | 7 | 6 | 5 | 3 |
| 60th | 190 (10) | 14 | 12 | 11 | 10 | 9 | 8 | 7 | 6 | 4 |
| 50th | 183 (10) | 15 | 13 | 12 | 11 | 10 | 9 | 8 | 7 | 5 |
| 40th | 178 (9) | 16 | 14 | 13 | 12 | 10 | 9 | 8 | 7 | 6 |
| 30th | 173 (9) | 16 | 14 | 13 | 12 | 11 | 10 | 9 | 8 | 6 |
| 20th | 167 (9) | 17 | 15 | 14 | 13 | 12 | 11 | 10 | 9 | 7 |
| 10th | 157 (8) | 18 | 16 | 15 | 14 | 13 | 12 | 11 | 10 | 8 |
RBI
| % | YTD | For 90th | For 80th | For 70th | For 60th | For 50th | For 40th | For 30th | For 20th | For 10th |
| 90th | 729 (38) | 38 | 34 | 31 | 29 | 26 | 24 | 22 | 18 | 14 |
| 80th | 704 (37) | 41 | 37 | 35 | 36 | 30 | 27 | 25 | 21 | 17 |
| 70th | 690 (36) | 43 | 39 | 36 | 38 | 31 | 29 | 27 | 23 | 19 |
| 60th | 676 (36) | 45 | 41 | 38 | 40 | 33 | 31 | 28 | 25 | 20 |
| 50th | 662 (35) | 47 | 42 | 40 | 41 | 35 | 32 | 30 | 26 | 22 |
| 40th | 648 (34) | 48 | 44 | 42 | 43 | 37 | 34 | 32 | 28 | 24 |
| 30th | 635 (33) | 50 | 46 | 43 | 45 | 38 | 36 | 33 | 30 | 25 |
| 20th | 615 (32) | 53 | 48 | 46 | 47 | 41 | 38 | 36 | 32 | 28 |
| 10th | 590 (31) | 56 | 51 | 49 | 50 | 44 | 41 | 39 | 35 | 31 |
Batting Average
This one is a little complicated, as it depends on at-bats (more at-bats = bigger boost in batting average, duh). For the sake of this practice, the below chart is based on the average amount of at-bats per week on a Main Event team, currently 266. Personally, I’d freak if one of my competitive teams was ever averaging that few at-bats. But to each their own, and for simplicity’s sake we’ll use the average across the ME here.
These are huge gaps to gain this late in the season. To jump from .249 (50th percentile) to .253 (70th percentile) would take hitting .263 RoS. Not impossible, but also pretty difficult to do for two months on a team that was middling in batting average to begin with.
| % | YTD | For 90th | For 80th | For 70th | For 60th | For 50th | For 40th | For 30th | For 20th | For 10th |
| 90th | 0.259 | 0.259 | 0.248 | 0.239 | 0.231 | 0.224 | 0.219 | 0.212 | 0.203 | 0.190 |
| 80th | 0.256 | 0.267 | 0.256 | 0.247 | 0.239 | 0.232 | 0.227 | 0.220 | 0.211 | 0.198 |
| 70th | 0.253 | 0.274 | 0.262 | 0.253 | 0.245 | 0.239 | 0.233 | 0.226 | 0.217 | 0.204 |
| 60th | 0.251 | 0.279 | 0.268 | 0.259 | 0.251 | 0.244 | 0.239 | 0.232 | 0.223 | 0.210 |
| 50th | 0.249 | 0.284 | 0.272 | 0.263 | 0.256 | 0.249 | 0.243 | 0.236 | 0.227 | 0.215 |
| 40th | 0.247 | 0.288 | 0.276 | 0.267 | 0.260 | 0.253 | 0.247 | 0.240 | 0.231 | 0.219 |
| 30th | 0.245 | 0.293 | 0.281 | 0.272 | 0.264 | 0.258 | 0.252 | 0.245 | 0.236 | 0.223 |
| 20th | 0.243 | 0.299 | 0.287 | 0.279 | 0.271 | 0.264 | 0.259 | 0.252 | 0.243 | 0.230 |
| 10th | 0.239 | 0.308 | 0.296 | 0.287 | 0.280 | 0.273 | 0.267 | 0.261 | 0.251 | 0.239 |
Strikeouts
This is one I always look at if I’m considering running out more RPs to go after saves. It’s important to be realistic about how many Ks you can get each week and what it might cost you. Other owners behind you in Ks by large margin may be punting saves and going after all the win and K points they can in a Hail Mary to cash, so this category can be worth digging into in tight races to see what your competition is doing.
| % | YTD | For 90th | For 80th | For 70th | For 60th | For 50th | For 40th | For 30th | For 20th | For 10th |
| 90th | 987 (52) | 52 | 47 | 44 | 41 | 37 | 34 | 30 | 24 | 17 |
| 80th | 995 (50) | 55 | 50 | 47 | 44 | 41 | 38 | 33 | 28 | 20 |
| 70th | (941) 50 | 58 | 53 | 50 | 46 | 43 | 40 | 35 | 30 | 23 |
| 60th | (932) 49 | 60 | 55 | 52 | 49 | 45 | 42 | 38 | 32 | 25 |
| 50th | 904 (48) | 62 | 57 | 54 | 51 | 48 | 45 | 40 | 35 | 27 |
| 40th | 887 (47) | 64 | 59 | 56 | 53 | 50 | 47 | 42 | 37 | 29 |
| 30th | 861 (45) | 68 | 63 | 60 | 56 | 53 | 50 | 45 | 40 | 33 |
| 20th | 832 (44) | 71 | 66 | 63 | 60 | 57 | 54 | 49 | 44 | 36 |
| 10th | 789 (42) | 77 | 72 | 68 | 65 | 62 | 59 | 54 | 49 | 42 |
Wins
| % | YTD | For 90th | For 80th | For 70th | For 60th | For 50th | For 40th | For 30th | For 20th | For 10th |
| 90th | 68 (3.6) | 3.6 | 2.9 | 2.5 | 2.2 | 1.8 | 1.6 | 1.1 | 0.7 | 0.0 |
| 80th | 64 (3.4) | 4.1 | 3.4 | 3.0 | 2.7 | 2.3 | 2.1 | 1.6 | 1.2 | 0.5 |
| 70th | 62 (3.3) | 4.3 | 3.6 | 3.3 | 2.9 | 2.6 | 2.3 | 1.8 | 1.5 | 0.8 |
| 60th | 60 (3.2) | 4.6 | 3.9 | 3.5 | 3.2 | 2.8 | 2.6 | 2.1 | 1.7 | 1.0 |
| 50th | 58 (3.1) | 4.8 | 4.1 | 3.8 | 3.4 | 3.1 | 2.8 | 2.3 | 2.0 | 1.3 |
| 40th | 57 (3.0) | 5.0 | 4.3 | 3.9 | 3.6 | 3.2 | 3.0 | 2.5 | 2.2 | 1.5 |
| 30th | 54 (2.8) | 5.3 | 4.6 | 4.3 | 3.9 | 3.6 | 3.3 | 2.8 | 2.5 | 1.8 |
| 20th | 52 (2.7) | 5.6 | 4.9 | 4.5 | 4.2 | 3.8 | 3.6 | 3.1 | 2.7 | 2.0 |
| 10th | 48 (2.5) | 6.1 | 5.4 | 5.0 | 4.7 | 4.3 | 4.1 | 3.6 | 3.2 | 2.5 |
Saves
| % | YTD | For 90th | For 80th | For 70th | For 60th | For 50th | For 40th | For 30th | For 20th | For 10th |
| 90th | 56 (2.9) | 2.9 | 1.9 | 1.2 | 0.6 | 0.1 | 0.0 | 0.0 | 0.0 | 0.0 |
| 80th | 50 (2.6) | 3.7 | 2.6 | 1.9 | 1.4 | 0.9 | 0.1 | 0.0 | 0.0 | 0.0 |
| 70th | 46 (2.4) | 4.2 | 3.1 | 2.4 | 1.9 | 1.4 | 0.6 | 0.0 | 0.0 | 0.0 |
| 60th | 43 (2.3) | 4.6 | 3.5 | 2.8 | 2.3 | 1.7 | 1.0 | 0.3 | 0.0 | 0.0 |
| 50th | 40 (2.1) | 4.9 | 3.9 | 3.2 | 2.6 | 2.1 | 1.4 | 0.7 | 0.0 | 0.0 |
| 40th | 36 (1.9) | 5.4 | 4.4 | 3.7 | 3.1 | 2.6 | 1.9 | 1.2 | 0.3 | 0.0 |
| 30th | 32 (1.7) | 5.9 | 4.9 | 4.1 | 3.6 | 3.1 | 2.4 | 1.7 | 0.8 | 0.0 |
| 20th | 27 (1.4) | 6.6 | 5.5 | 4.8 | 4.3 | 3.7 | 3.0 | 2.3 | 1.4 | 0.5 |
| 10th | 22 (1.2) | 7.2 | 6.1 | 5.4 | 4.9 | 4.4 | 3.6 | 3.0 | 2.0 | 1.2 |
ERA
Just like batting average, this will depend on IP. Again, for simplicity I’m using the average amount of IP on a Main Event team, 48 IP per week.
Just like batting average, making up big gaps in ERA and WHIP this time of year is a tall task. If you have around the 20th percentile mark in ERA (4.09) and think you can trim that to 3.75 before season’s end, you can see here that would take a rest of season ERA of 2.94. Good luck with that.
| % | YTD | For 90th | For 80th | For 70th | For 60th | For 50th | For 40th | For 30th | For 20th | For 10th |
| 90th | 3.47 | 3.47 | 3.82 | 4.18 | 4.43 | 4.72 | 4.95 | 5.29 | 5.58 | 6.13 |
| 80th | 3.57 | 3.22 | 3.57 | 3.93 | 4.18 | 4.47 | 4.71 | 5.04 | 5.33 | 5.88 |
| 70th | 3.68 | 2.96 | 3.32 | 3.68 | 3.92 | 4.22 | 4.45 | 4.79 | 5.07 | 5.63 |
| 60th | 3.75 | 2.79 | 3.14 | 3.50 | 3.75 | 4.04 | 4.28 | 4.61 | 4.90 | 5.46 |
| 50th | 3.84 | 2.58 | 2.93 | 3.29 | 3.54 | 3.84 | 4.07 | 4.41 | 4.69 | 5.25 |
| 40th | 3.91 | 2.42 | 2.77 | 3.13 | 3.38 | 3.67 | 3.91 | 4.24 | 4.53 | 5.08 |
| 30th | 4.01 | 2.18 | 2.53 | 2.89 | 3.14 | 3.44 | 3.67 | 4.01 | 4.29 | 4.85 |
| 20th | 4.09 | 1.98 | 2.33 | 2.69 | 2.94 | 3.24 | 3.47 | 3.80 | 4.09 | 4.65 |
| 10th | 4.26 | 1.59 | 1.94 | 2.30 | 2.55 | 2.84 | 3.08 | 3.41 | 3.70 | 4.26 |
WHIP
| % | YTD | For 90th | For 80th | For 70th | For 60th | For 50th | For 40th | For 30th | For 20th | For 10th |
| 90th | 1.13 | 1.13 | 1.23 | 1.29 | 1.34 | 1.39 | 1.44 | 1.51 | 1.56 | 1.66 |
| 80th | 1.16 | 1.06 | 1.16 | 1.22 | 1.28 | 1.32 | 1.37 | 1.44 | 1.49 | 1.59 |
| 70th | 1.18 | 1.02 | 1.12 | 1.18 | 1.23 | 1.28 | 1.33 | 1.39 | 1.45 | 1.55 |
| 60th | 1.20 | 0.98 | 1.08 | 1.14 | 1.20 | 1.24 | 1.29 | 1.36 | 1.41 | 1.51 |
| 50th | 1.21 | 0.95 | 1.05 | 1.11 | 1.16 | 1.21 | 1.26 | 1.32 | 1.38 | 1.48 |
| 40th | 1.22 | 0.91 | 1.01 | 1.07 | 1.13 | 1.17 | 1.22 | 1.29 | 1.34 | 1.44 |
| 30th | 1.24 | 0.87 | 0.97 | 1.03 | 1.08 | 1.13 | 1.18 | 1.24 | 1.30 | 1.40 |
| 20th | 1.26 | 0.83 | 0.93 | 0.99 | 1.04 | 1.09 | 1.14 | 1.21 | 1.26 | 1.36 |
| 10th | 1.29 | 0.76 | 0.86 | 0.92 | 0.97 | 1.02 | 1.07 | 1.13 | 1.19 | 1.29 |
